Integration Astra with Grafana
Grafana is an open source analytics and interactive visualization web application. It works in pair with InfluxDB to visualize status of the Astra, stream, and adapters.
Install
Section titled “Install”Before Grafana installation, make sure that InfluxDB installed and configured: Read more…
Download latest version from
- Go to Grafana site: https://grafana.com/grafana/download
- Choose latest version
- Choose your platform
- Launch commands from the instruction on the Grafana site
Find out more information on official site: https://grafana.com/docs/grafana/latest/
Grafana configuration
Section titled “Grafana configuration”- Open Grafana Admin interface:
http://grafana-server:3000 - On the login page, enter
adminfor username and password - Set new password
Append data source
Section titled “Append data source”Open Settings → Data Sources and click “Append data source”, choose InfluxDB and set next options:
- Name:
Astraor any other - Query language: Flux
- HTTP URL:
http://db-server:8086 - Turn off Basic auth
- Organization: your organization name in InfluxDB Settings
- Token: your token copied for Astra settings
- Min time interval:
1m
Click Save & Test, you should see green notification: Bucket found
Append dashboard
Section titled “Append dashboard”- Download our template for Grafana: dashboard.json
- Open: Create → Import
- Click Upload JSON file
- Choose downloaded file
- Set any name for dashboard
- Click Import
Dashboard
Section titled “Dashboard”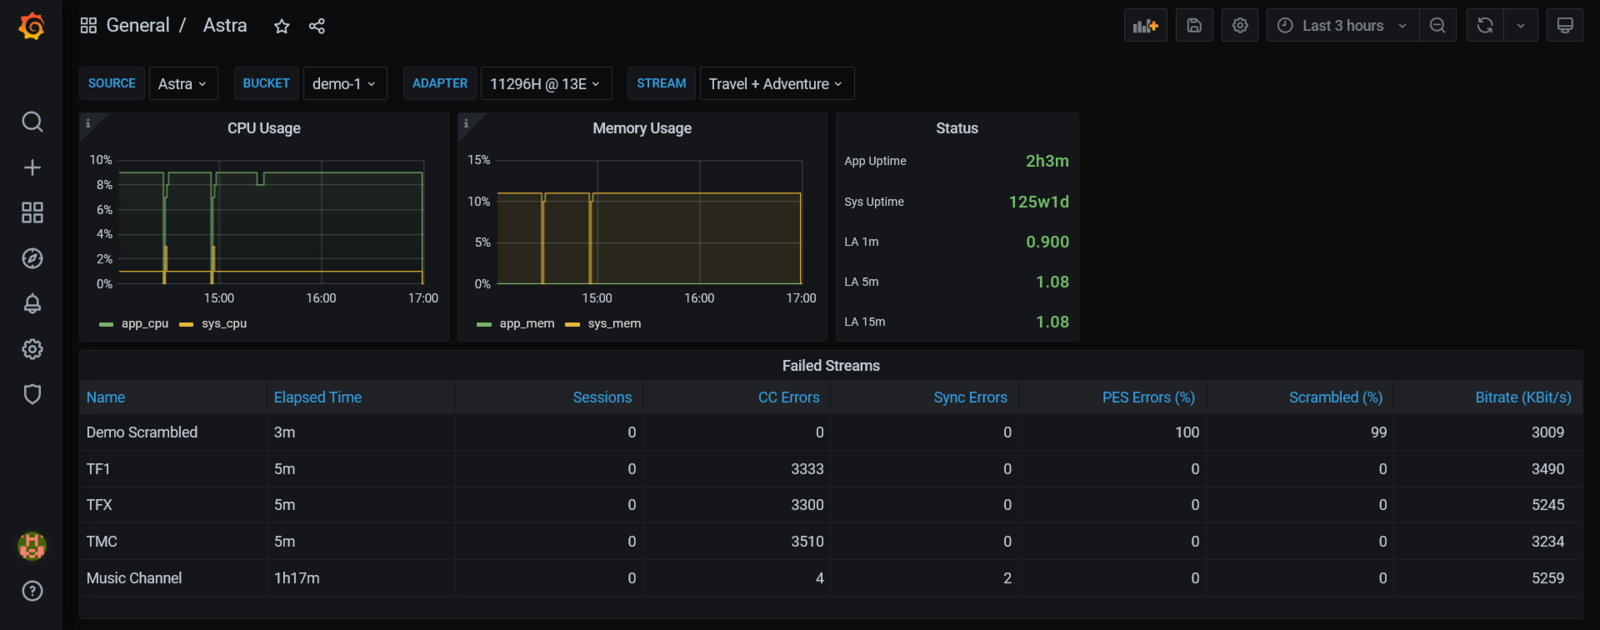
Dashboard has next variables:
- Source: choose Astra or other name;
- Bucket: this is database name in the InfluxDB. Same as Instance Name in the Astra settings. If you have several servers or different Astra instances on the same server you can create several dashboards for each instance;
- Adapter: All DVB adapters on the instance;
- Stream: All streams on the instance.
Status panels
Section titled “Status panels”CPU Usage:
- The System CPU usage is for all available cores. Max value is a number of cores multiplied by 100
- The App CPU usage is for all threads on all cores and relative to the System CPU usage
Memory Usage:
- The System Memory Usage - is total memory usage by all processes in the system
- The App Memory Usage - is total memory usage by all app threads. Value is relative to the system memory usage
Status:
- App uptime: elapsed time since app launched
- Sys uptime: elapsed time since system startup
- LA 1m: load average for 1 minute
- LA 5m: load average for 5 minutes
- LA 15m: load average for 15 minutes
Failed Streams - list of all incidents ordered by the time. Recent events on top of the table. All values in the table at the event time:
- Name: stream name
- Elapsed time: time since incidents happened
- Sessions: number of HTTP/HLS sessions
- CC Errors: counter of the detected packet loss events
- Sync Errors: counter of the HTTP/HLS bitrate synchronization errors
- PES Errors: percent of the video/audio packets with the corrupted content
- Scrambled: percent of the scrambled packets
- Bitrate: stream bitrate in KBit/s
Adapters and streams:
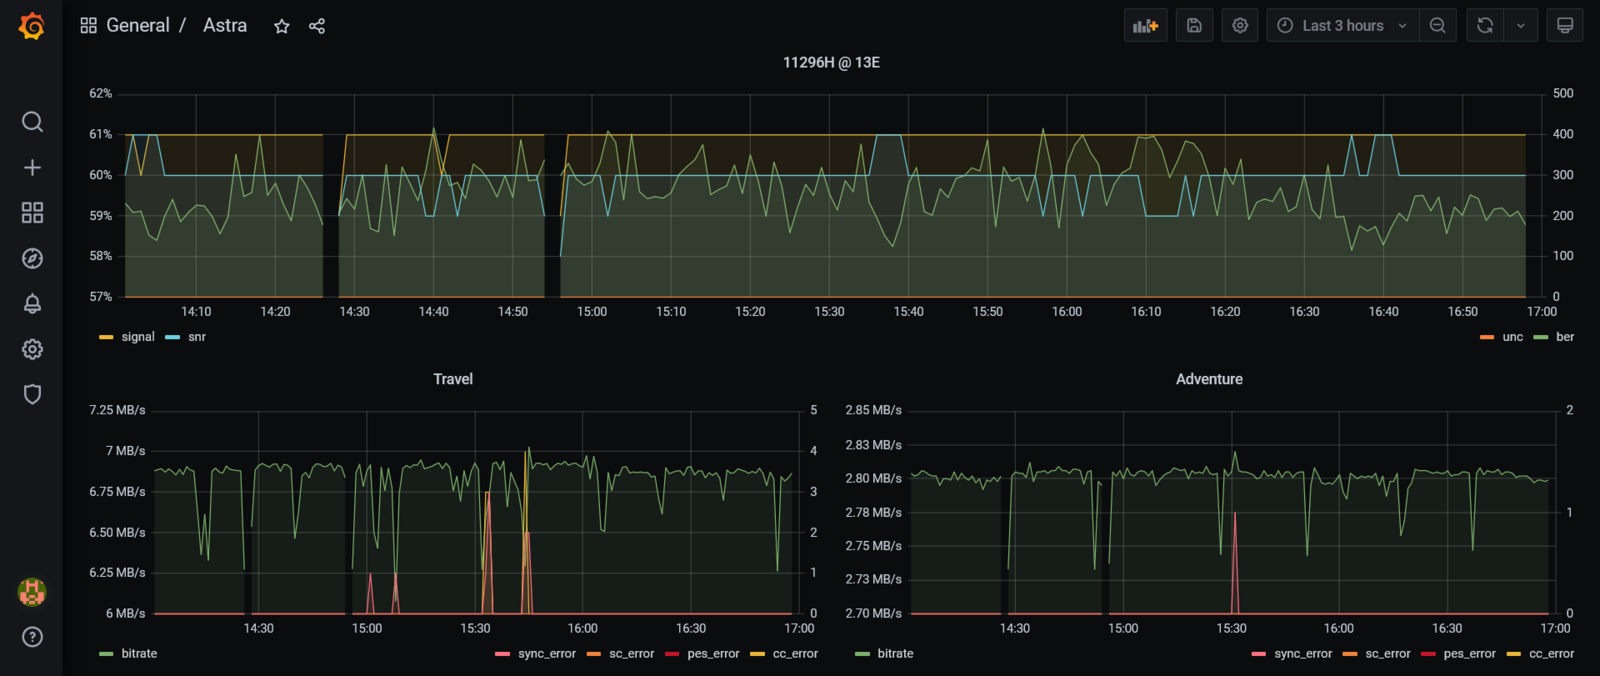
Charts displayed separately for each selected adapter or streams.